

Scatter Plots Stations Activity | Lines of Best Fit, Correlation & Analyze
CLICK HERE IF YOU WOULD RATHER PURCHASE THIS ON TPT
Grab these scatter plots math stations to supplement your 8th grade math statistics unit. These stations focus on correlation and informally analyzing lines of best fit. Students will create, analyze, estimate and explain. Students will develop a deep understanding of this content after completing these math stations.
Stations Included:
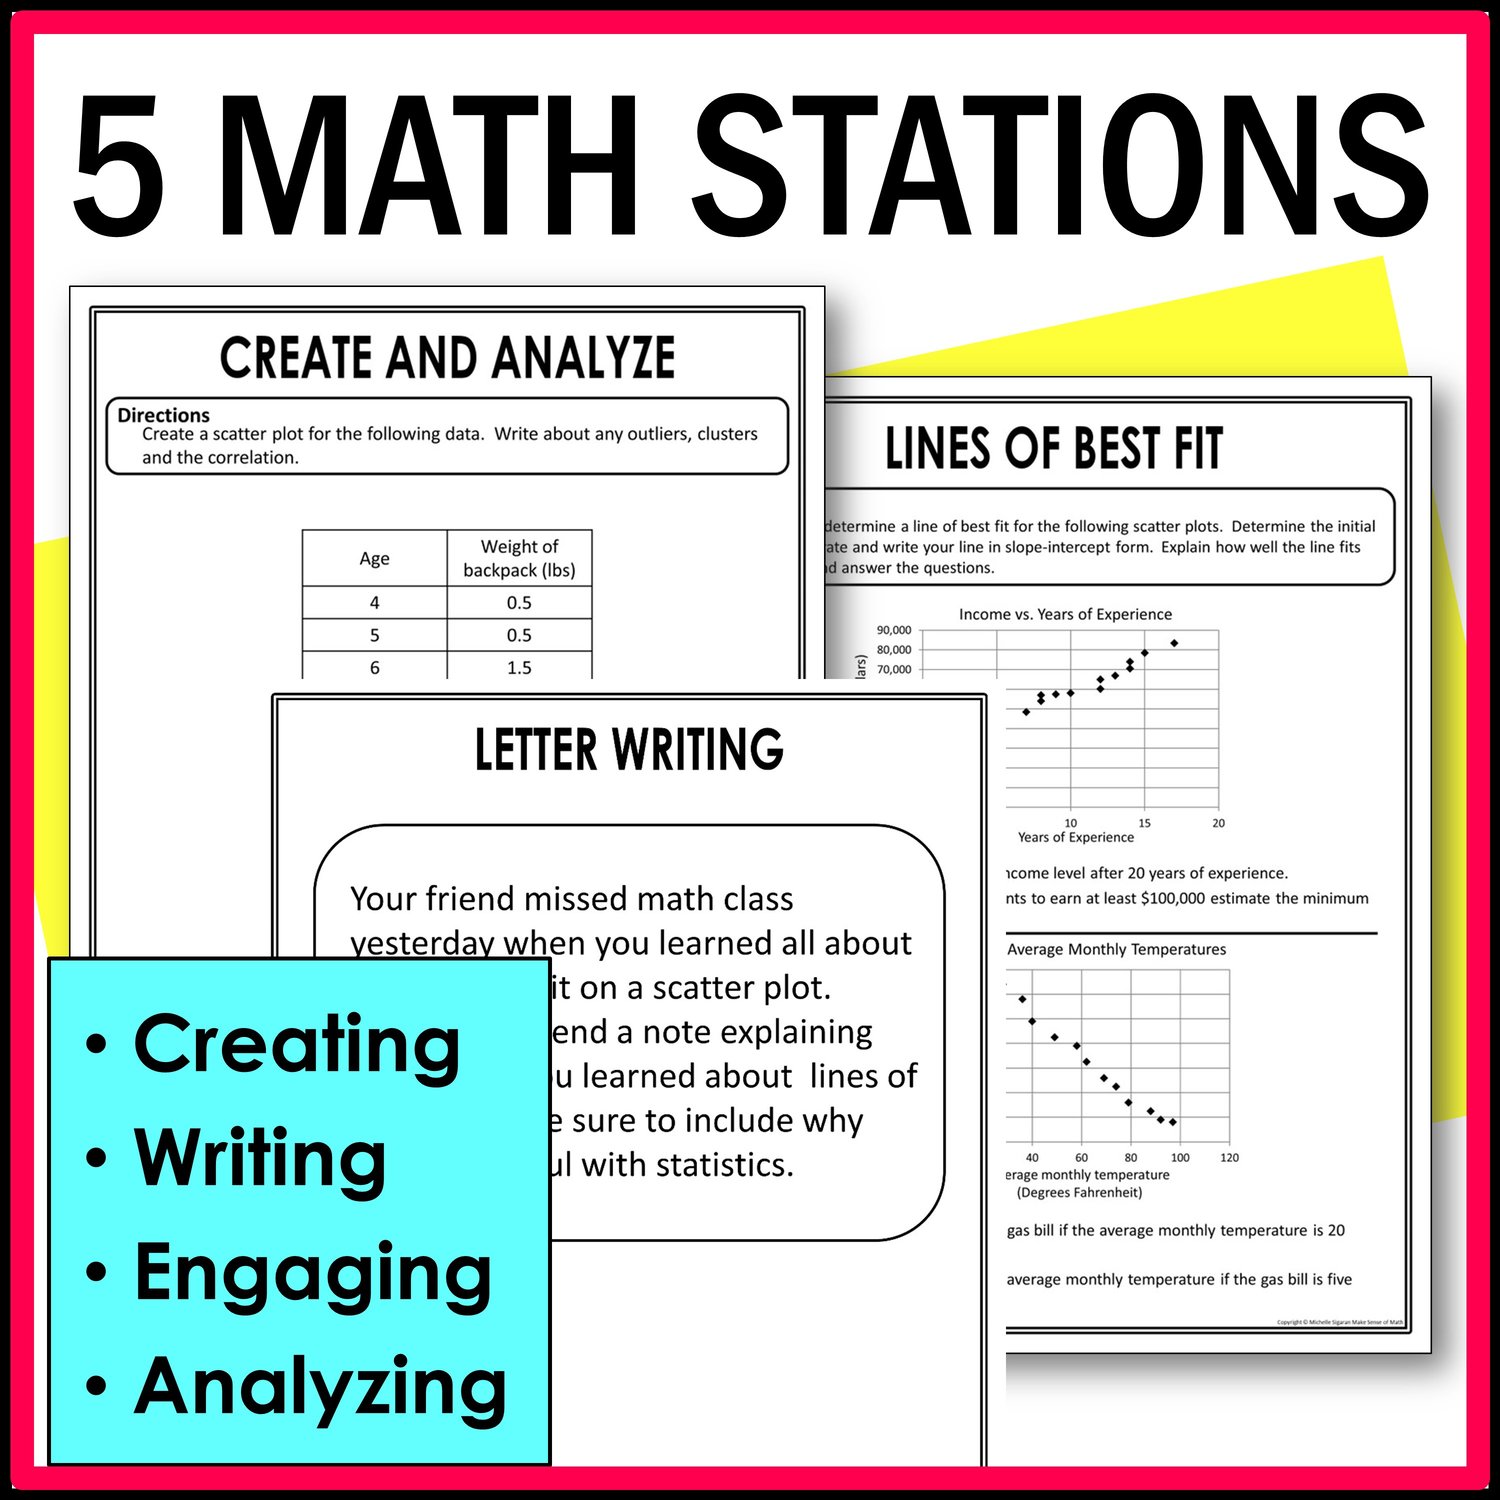
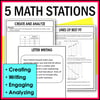
- Create and Analyze: Students will create and analyze a scatter plot. Noticing correlation, outliers and clusters.
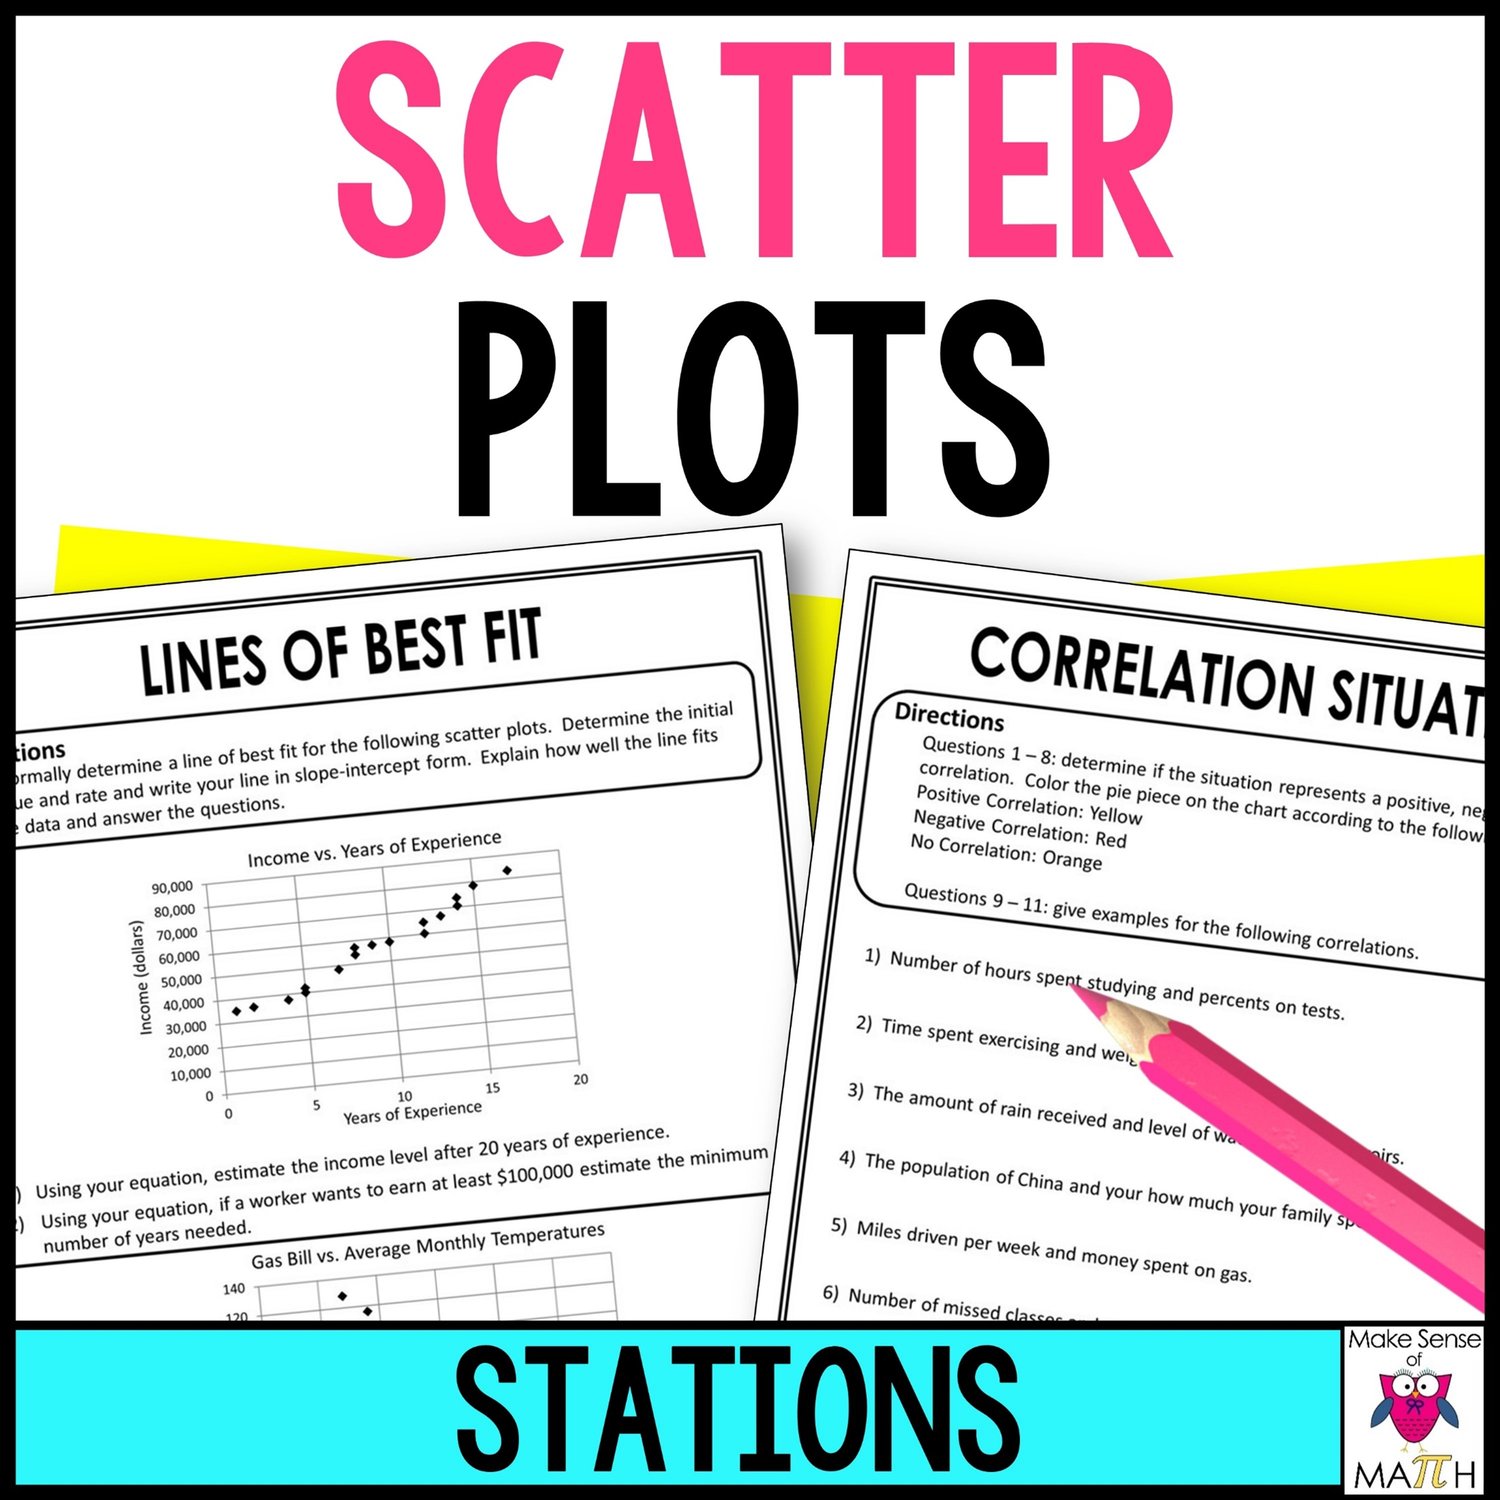
- Lines of Best Fit: Students are given a scatter plot and are to informally draw and write an equation for a line of best fit. This is done by estimating not by actually calculating. They will then use the line of best fit to make predictions.
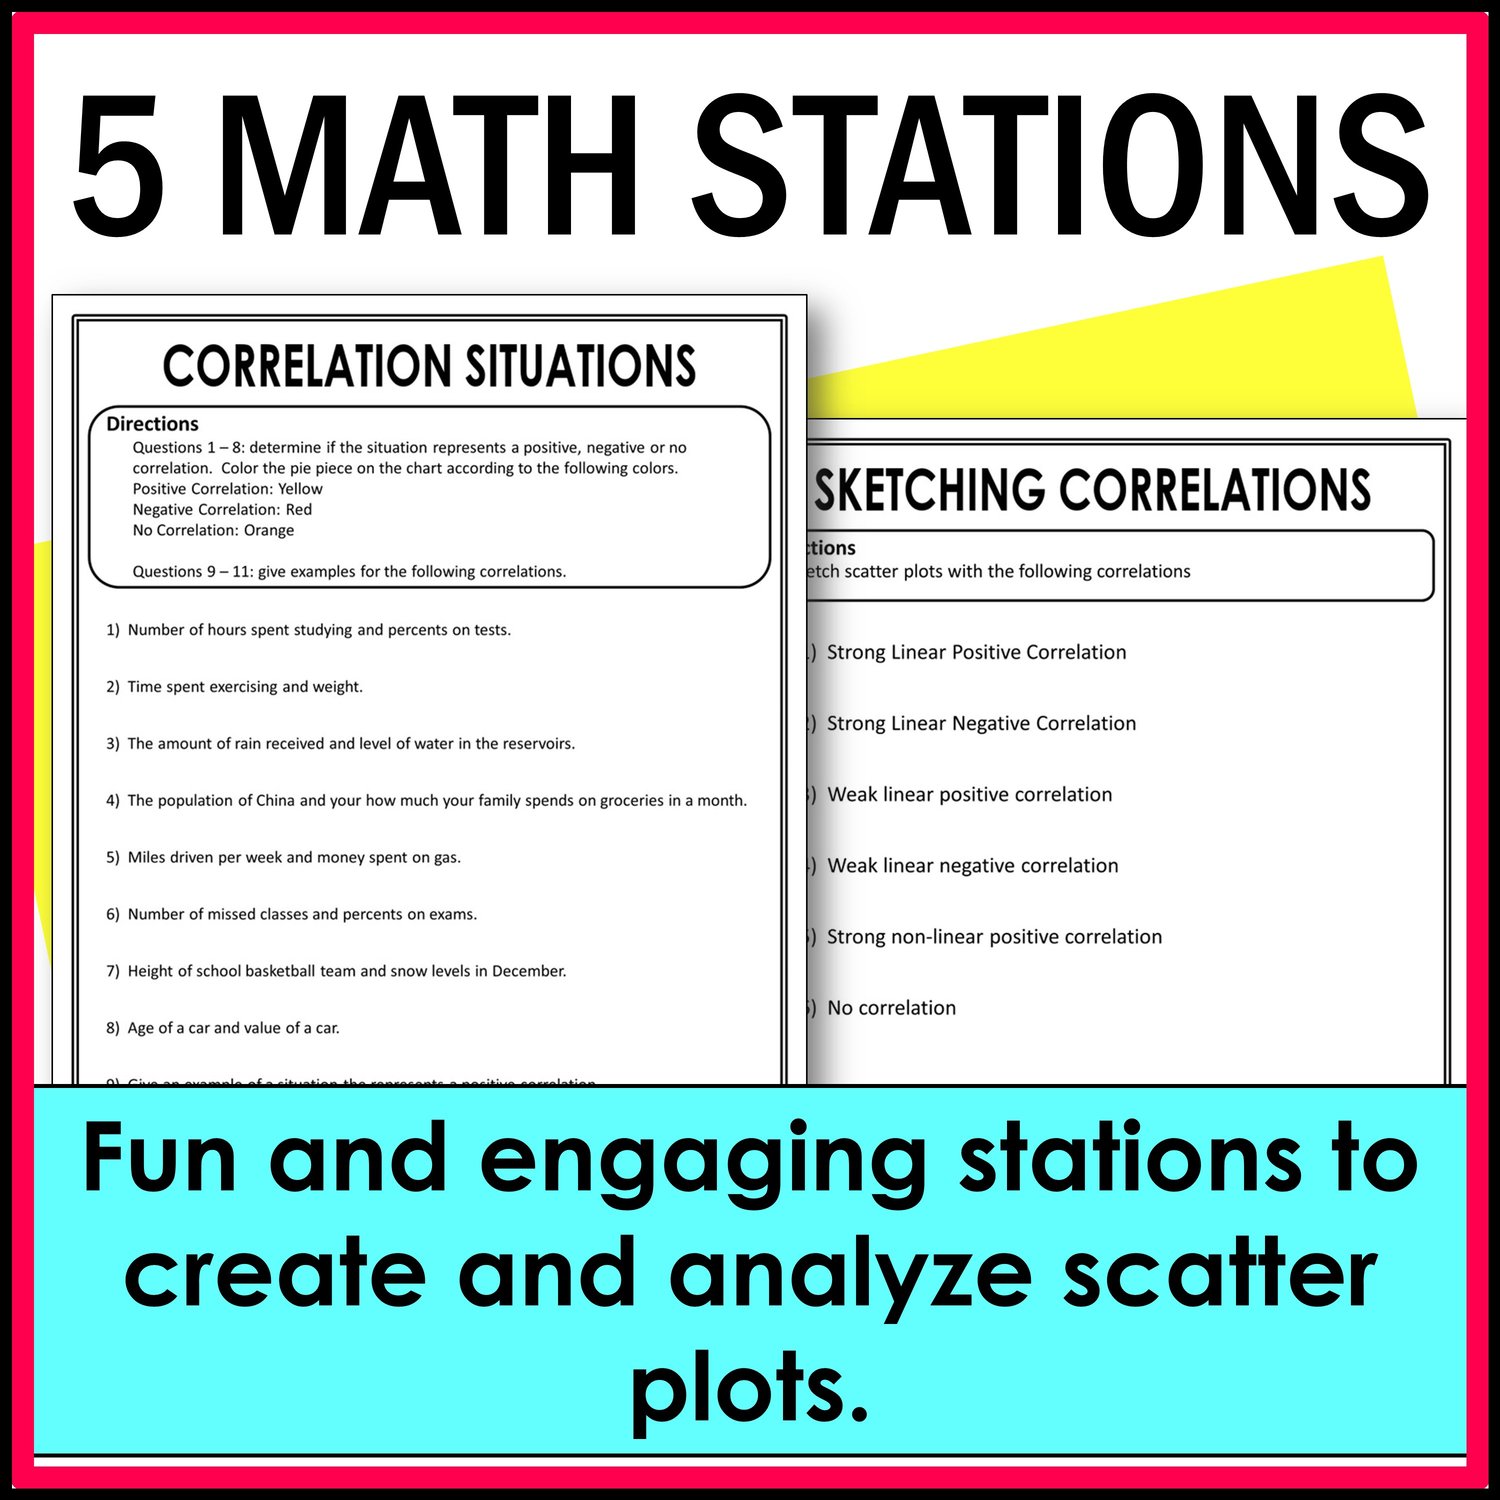
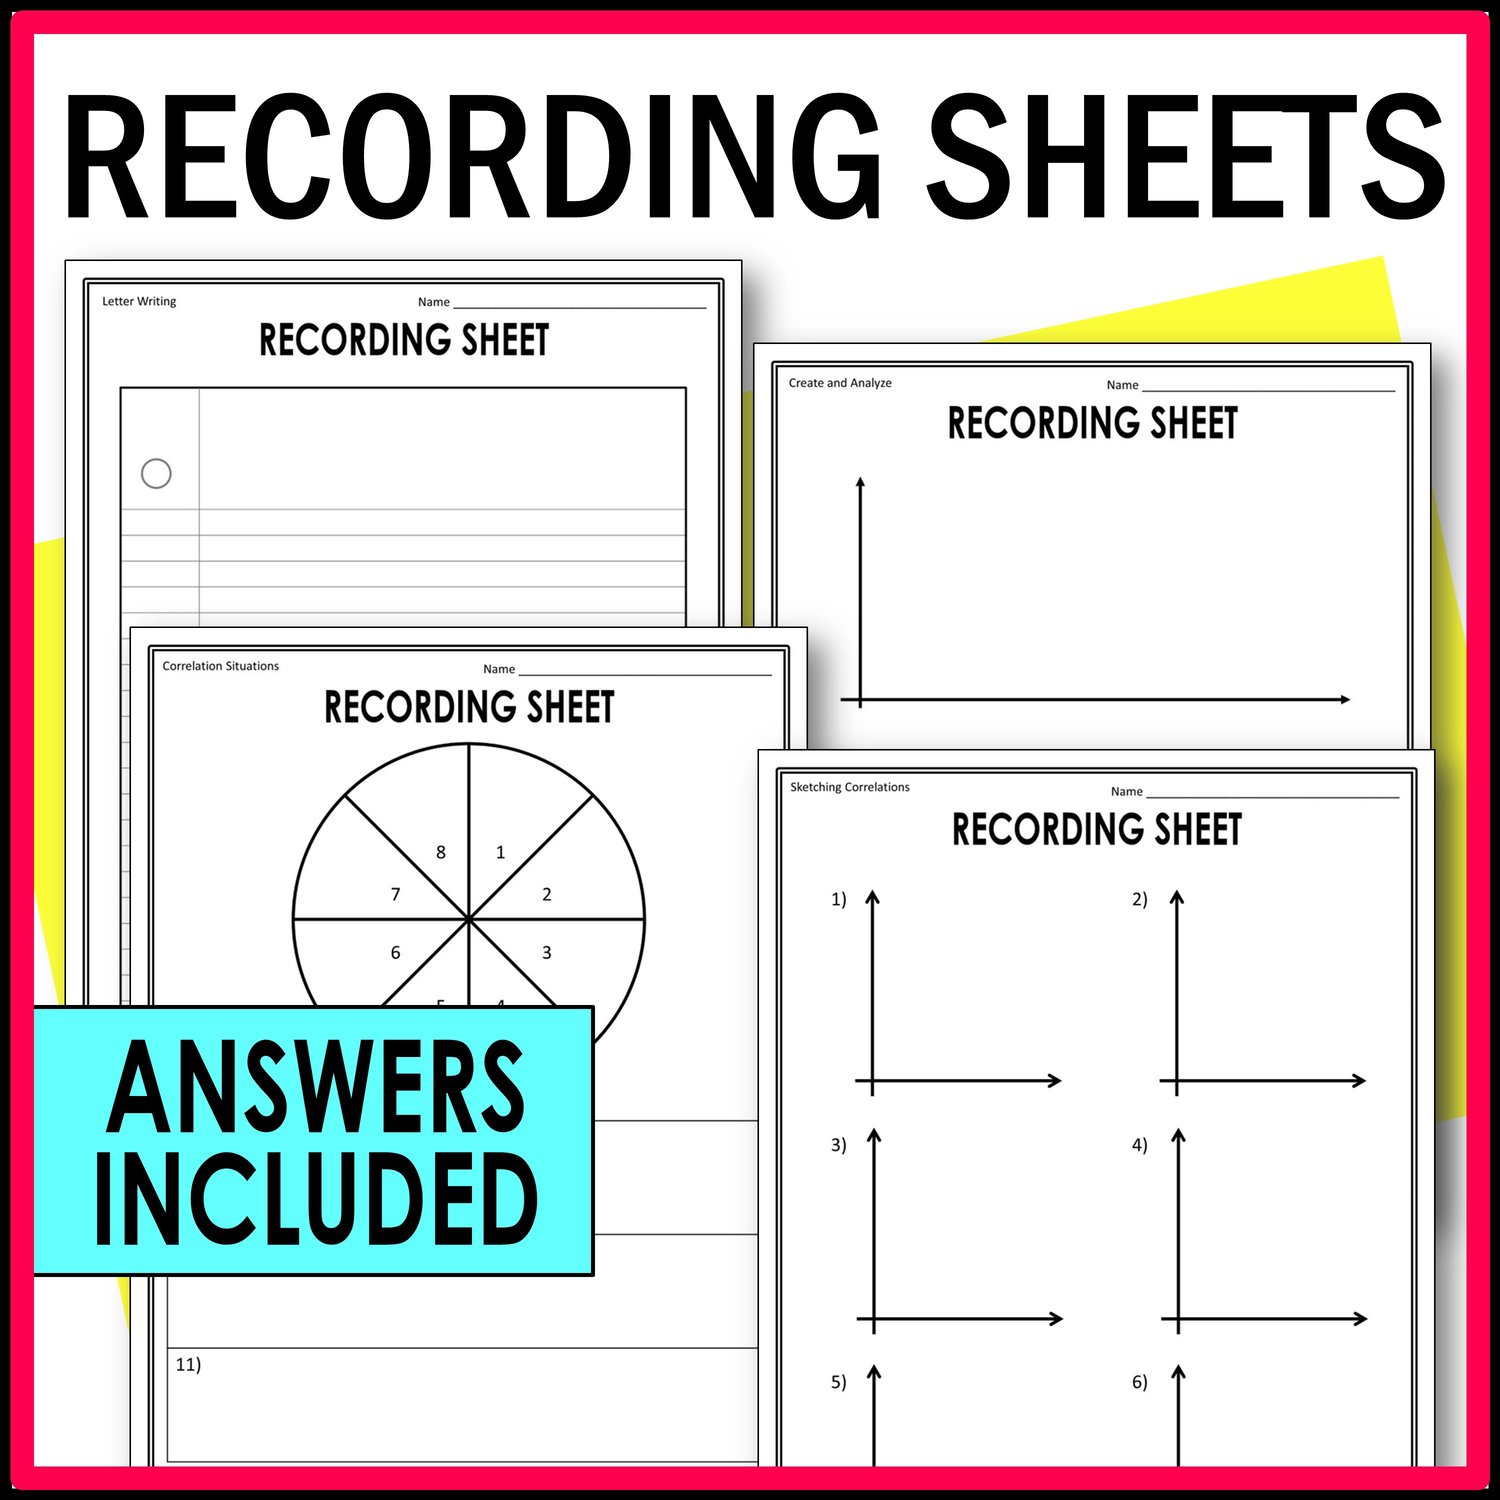
- Sketching Correlations: Students will sketch various scatter plots given certain correlations.
- Correlation Situations: Given situations, students will determine the type of correlation and will also create situations for certain correlations.
- Letter Writing: Students will write a letter to their friend about everything they learned about lines of best fit.
No refunds will be given. Please contact me for any questions. 😊
One purchase is for one teacher/family. You may only use this item with students in a single classroom/family.
Copyright © Michelle Sigaran Make Sense of Math, All Rights Reserved.
This item is also bound by copyright laws. Redistributing, editing, selling, or posting this item (or any part thereof) freely on the Internet are all strictly prohibited without first gaining permission from the author. Violations are subject to the penalties of the Digital Millennium Copyright Act.