


Statistics for Middle School Math Anchor Charts Posters
CLICK HERE IF YOU WOULD RATHER PURCHASE THIS ON TPT
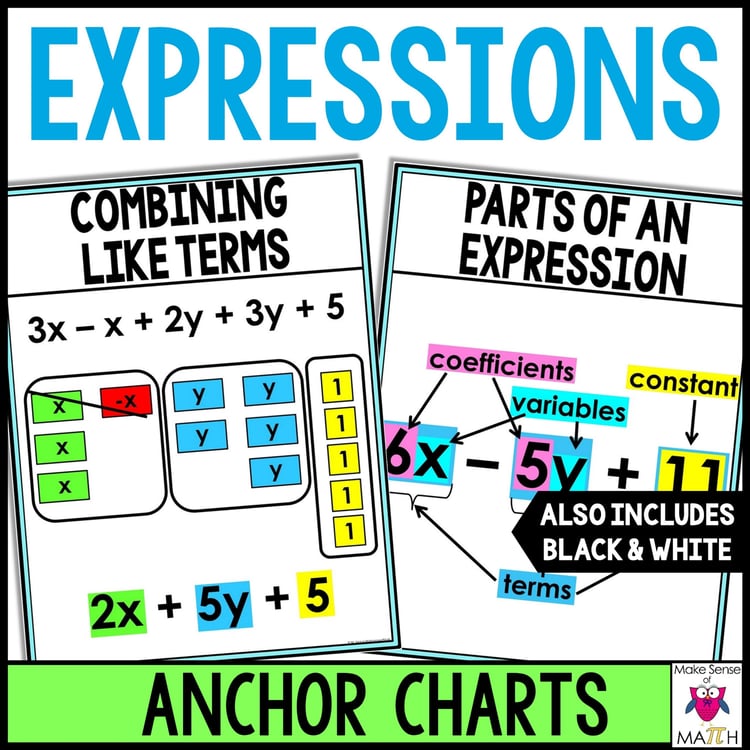
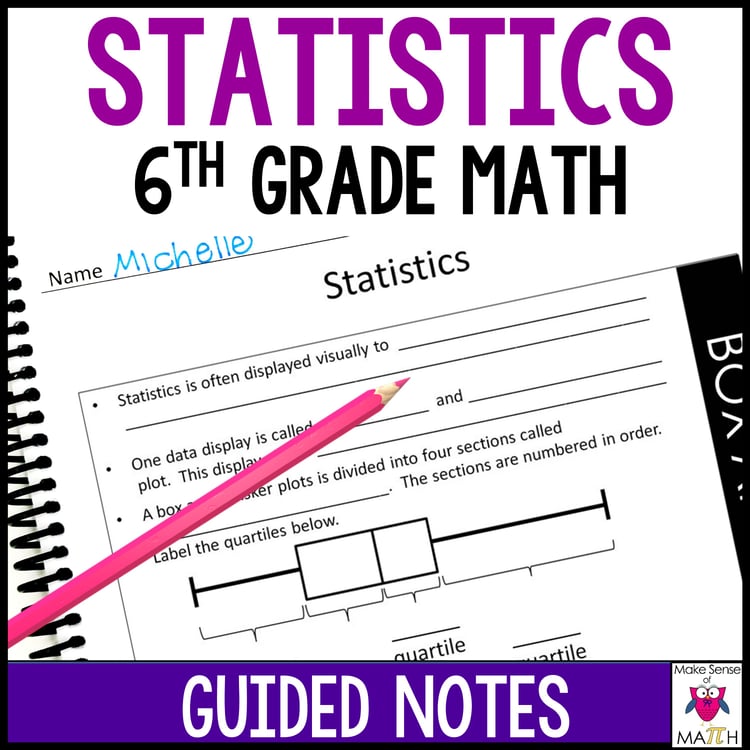
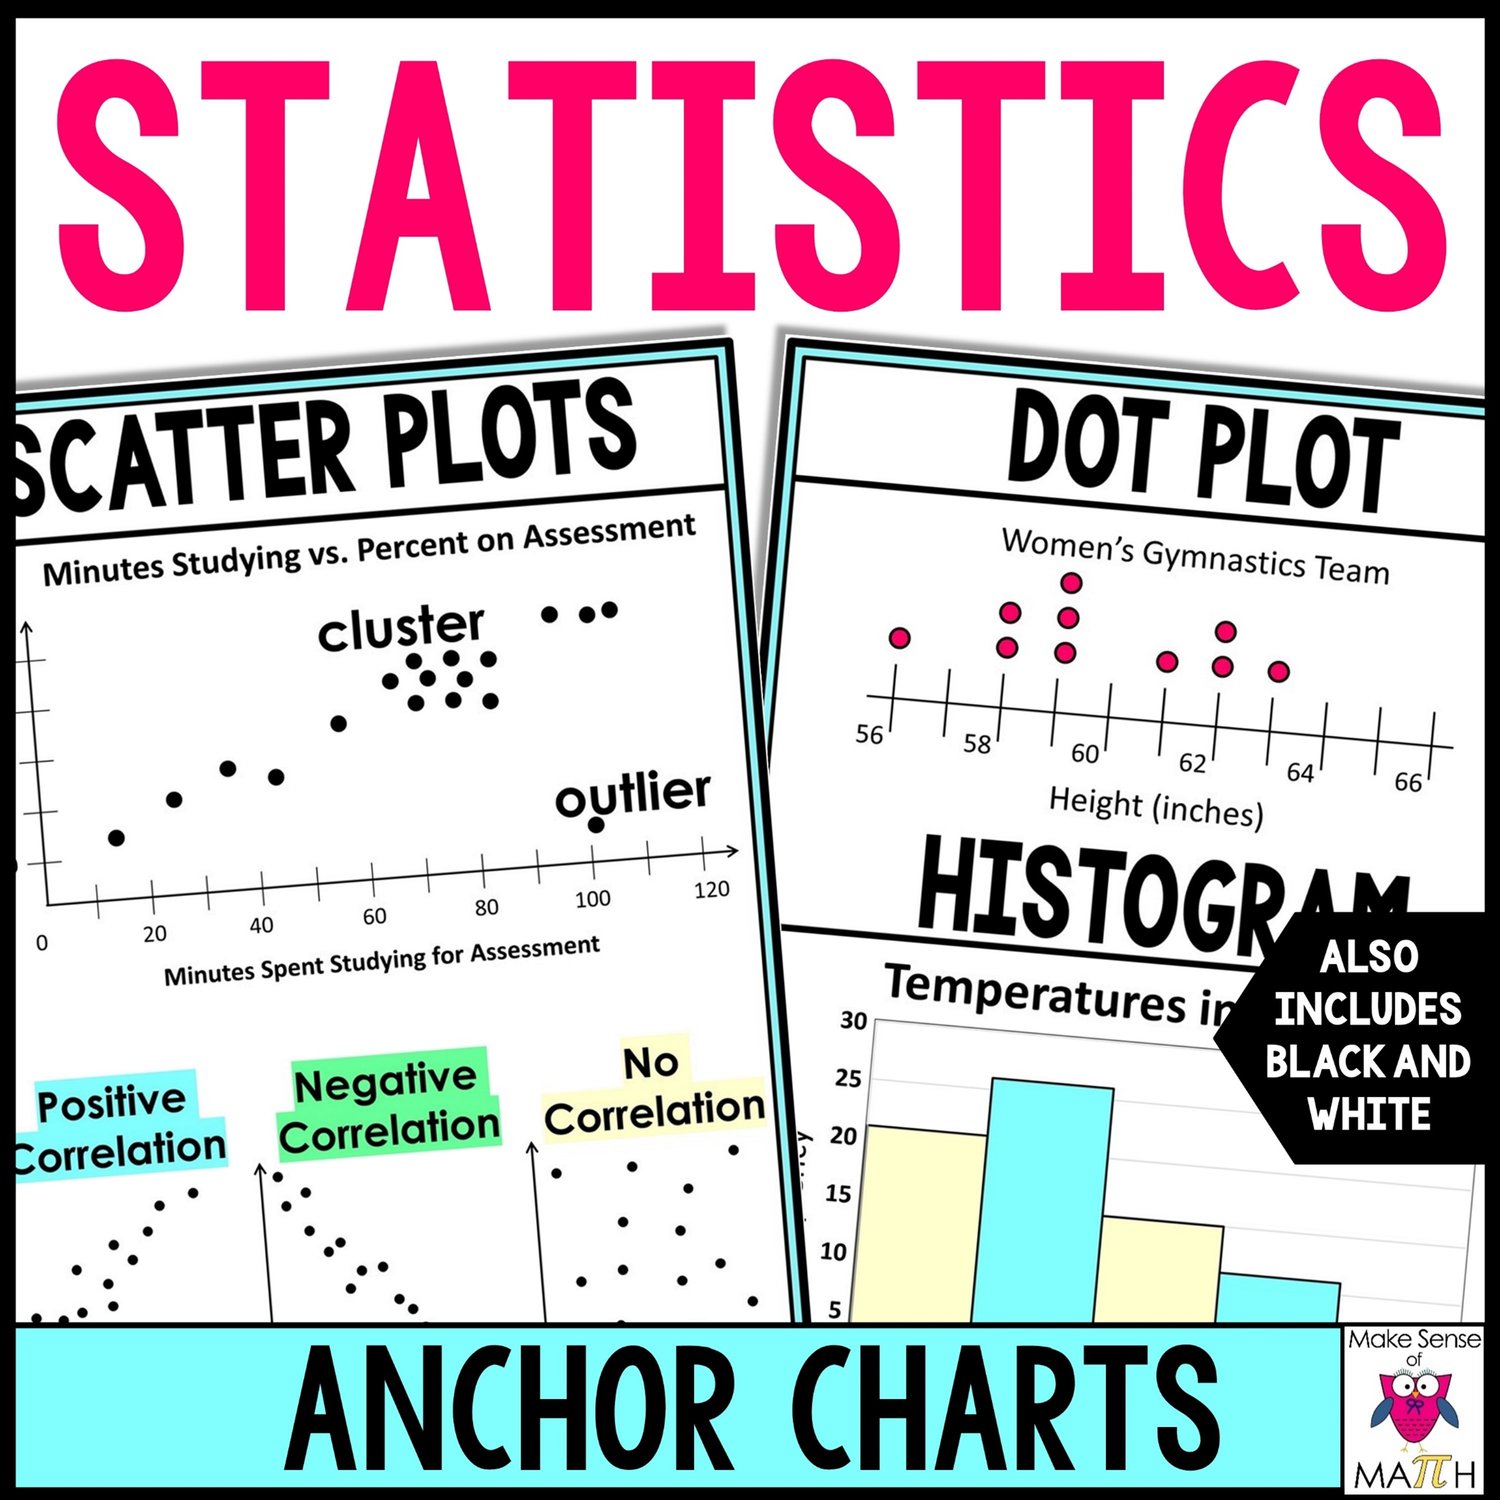
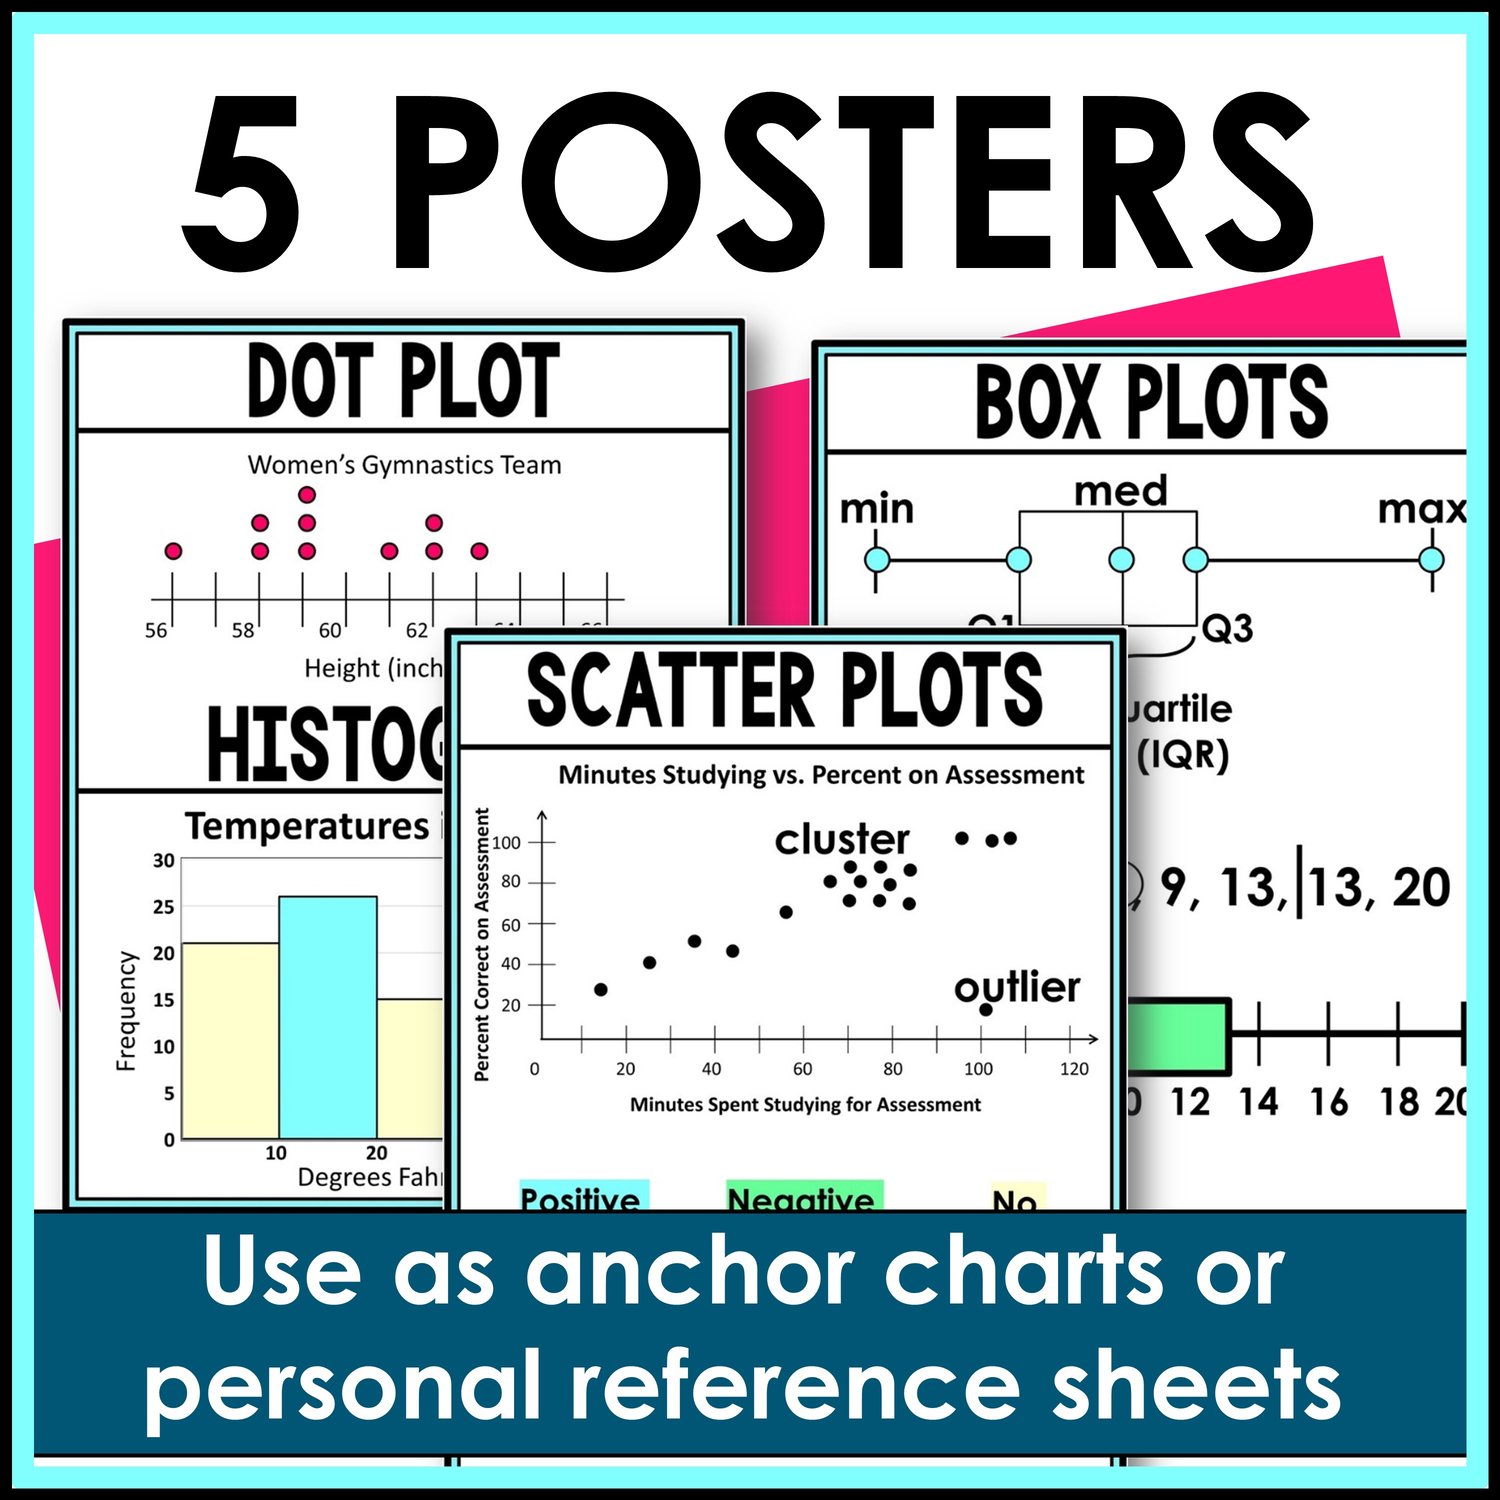
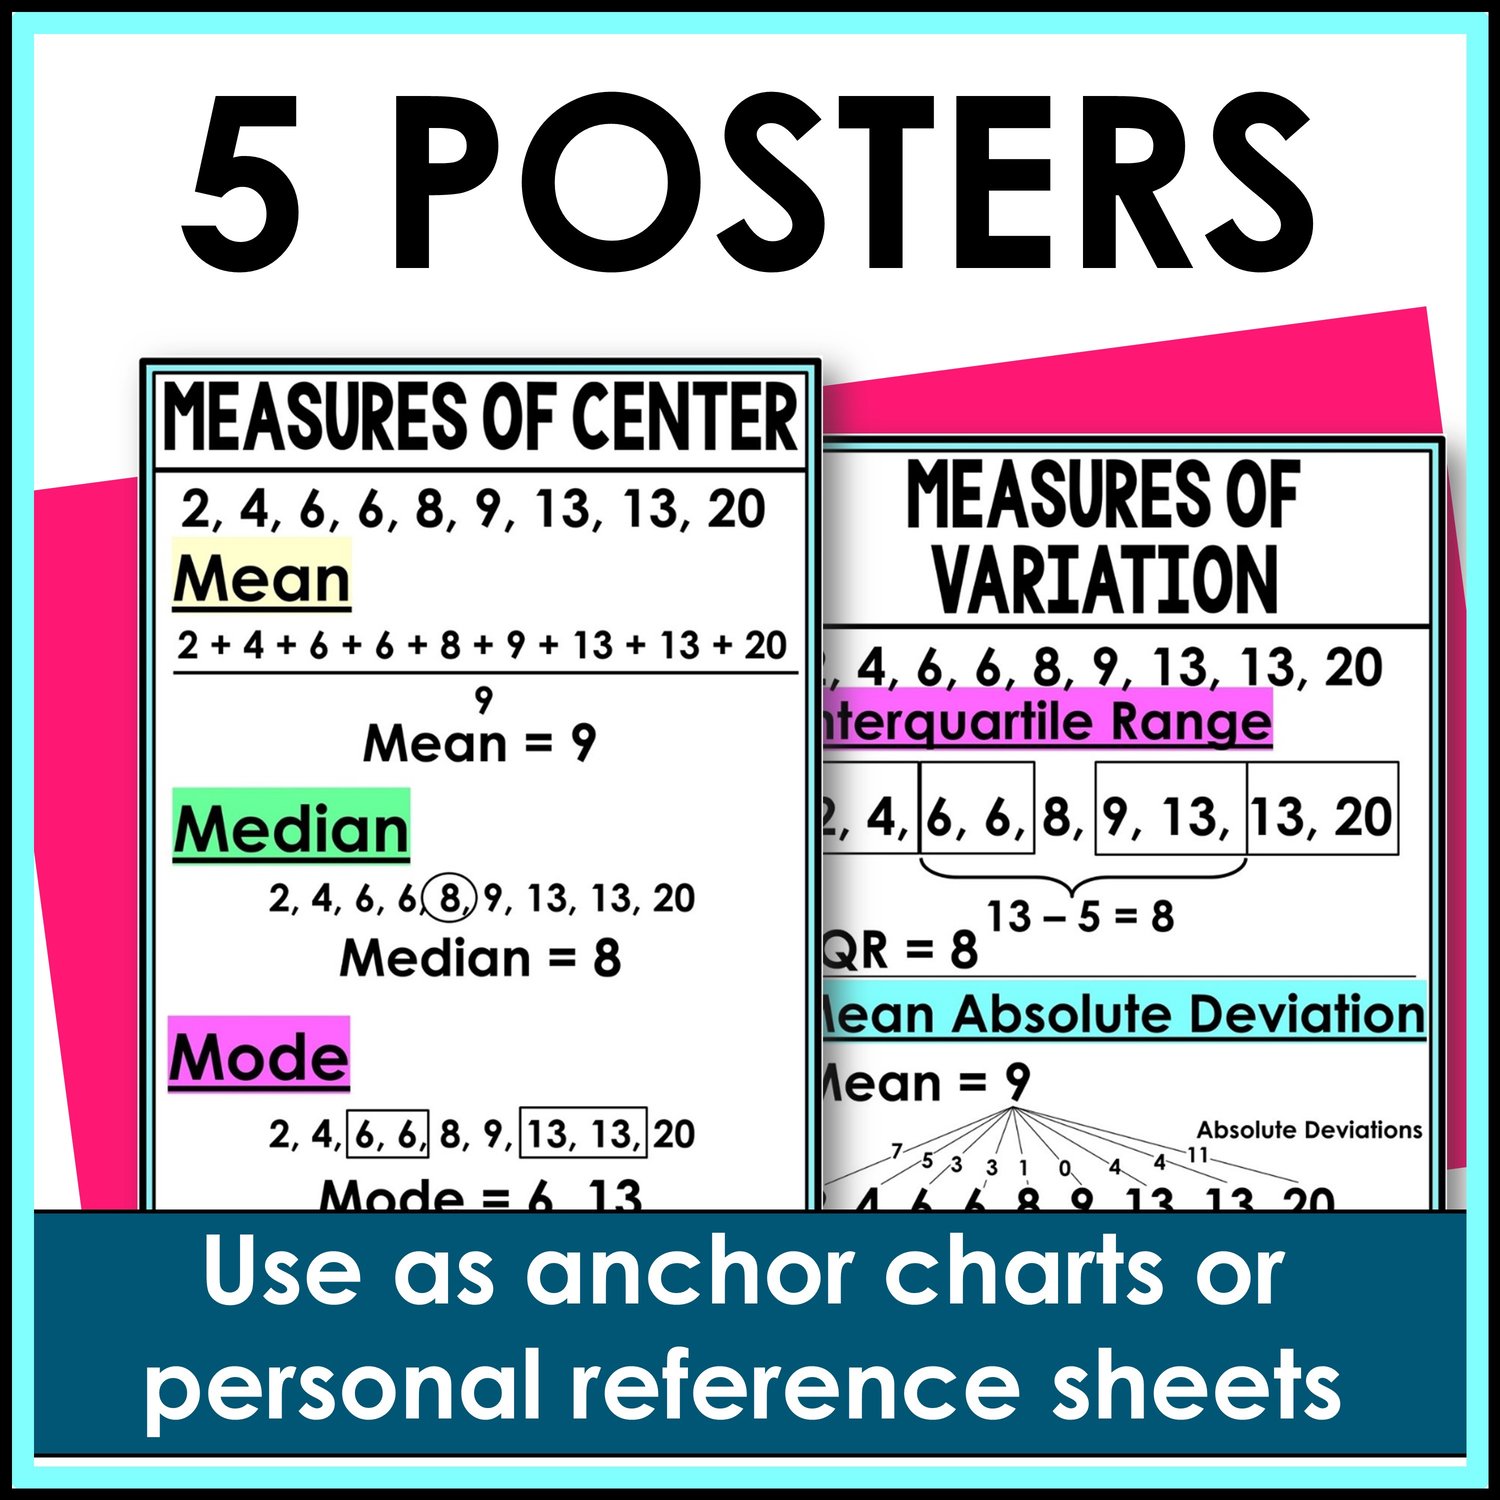
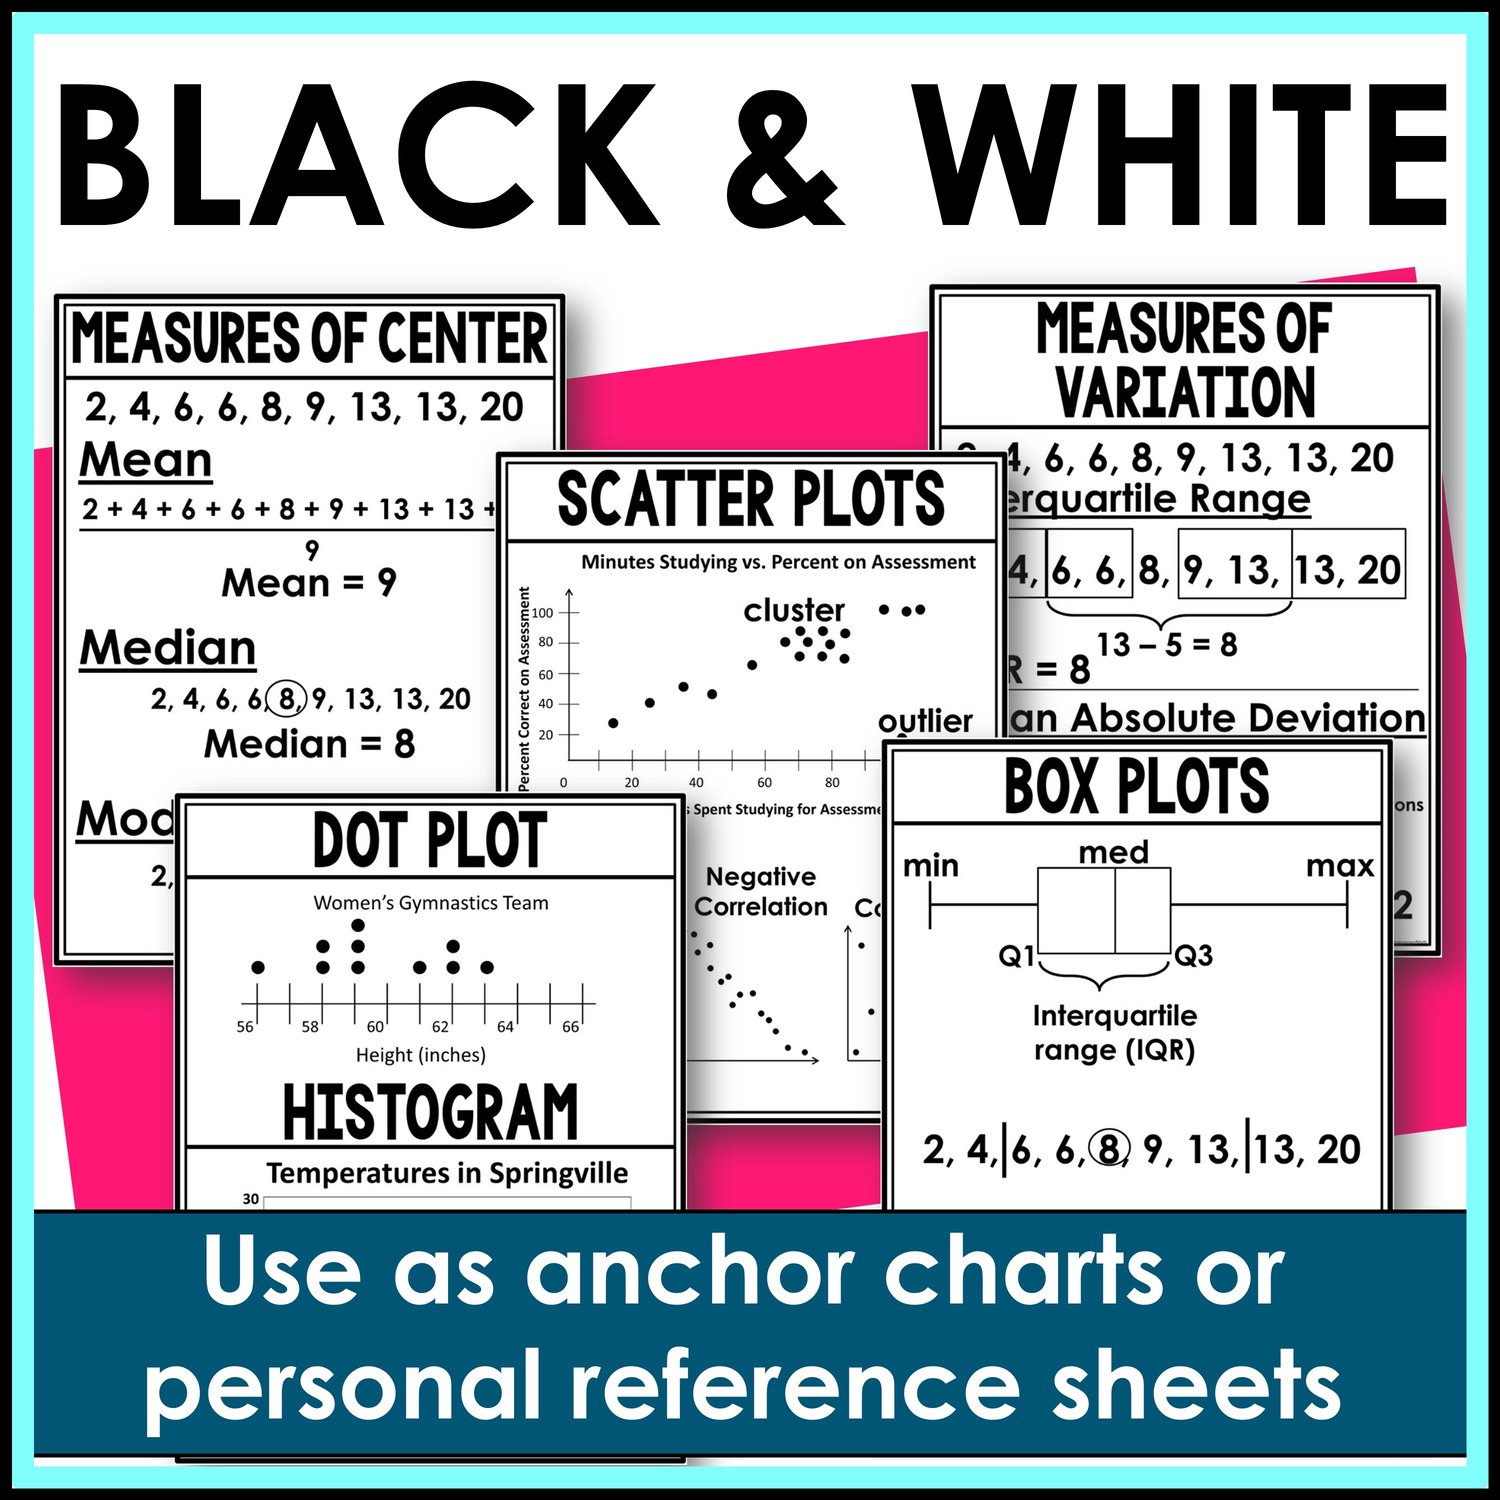
Do you teach statistics in middle school math? You will love these anchor charts and personal reference sheets that include visuals for dot plots, histograms, box plots, and scatter plots. They also include measures of center: mean, median, and mode, as well as measures of variation: interquartile range and mean absolute deviation.
Includes colored and black & white copies.
Includes:
- Dot Plot and Histogram
- Box Plot
- Measures of Center: Mean, Median, Mode
- Measures of Variation: Interquartile Range, Mean Absolute Deviation
- Scatter Plots
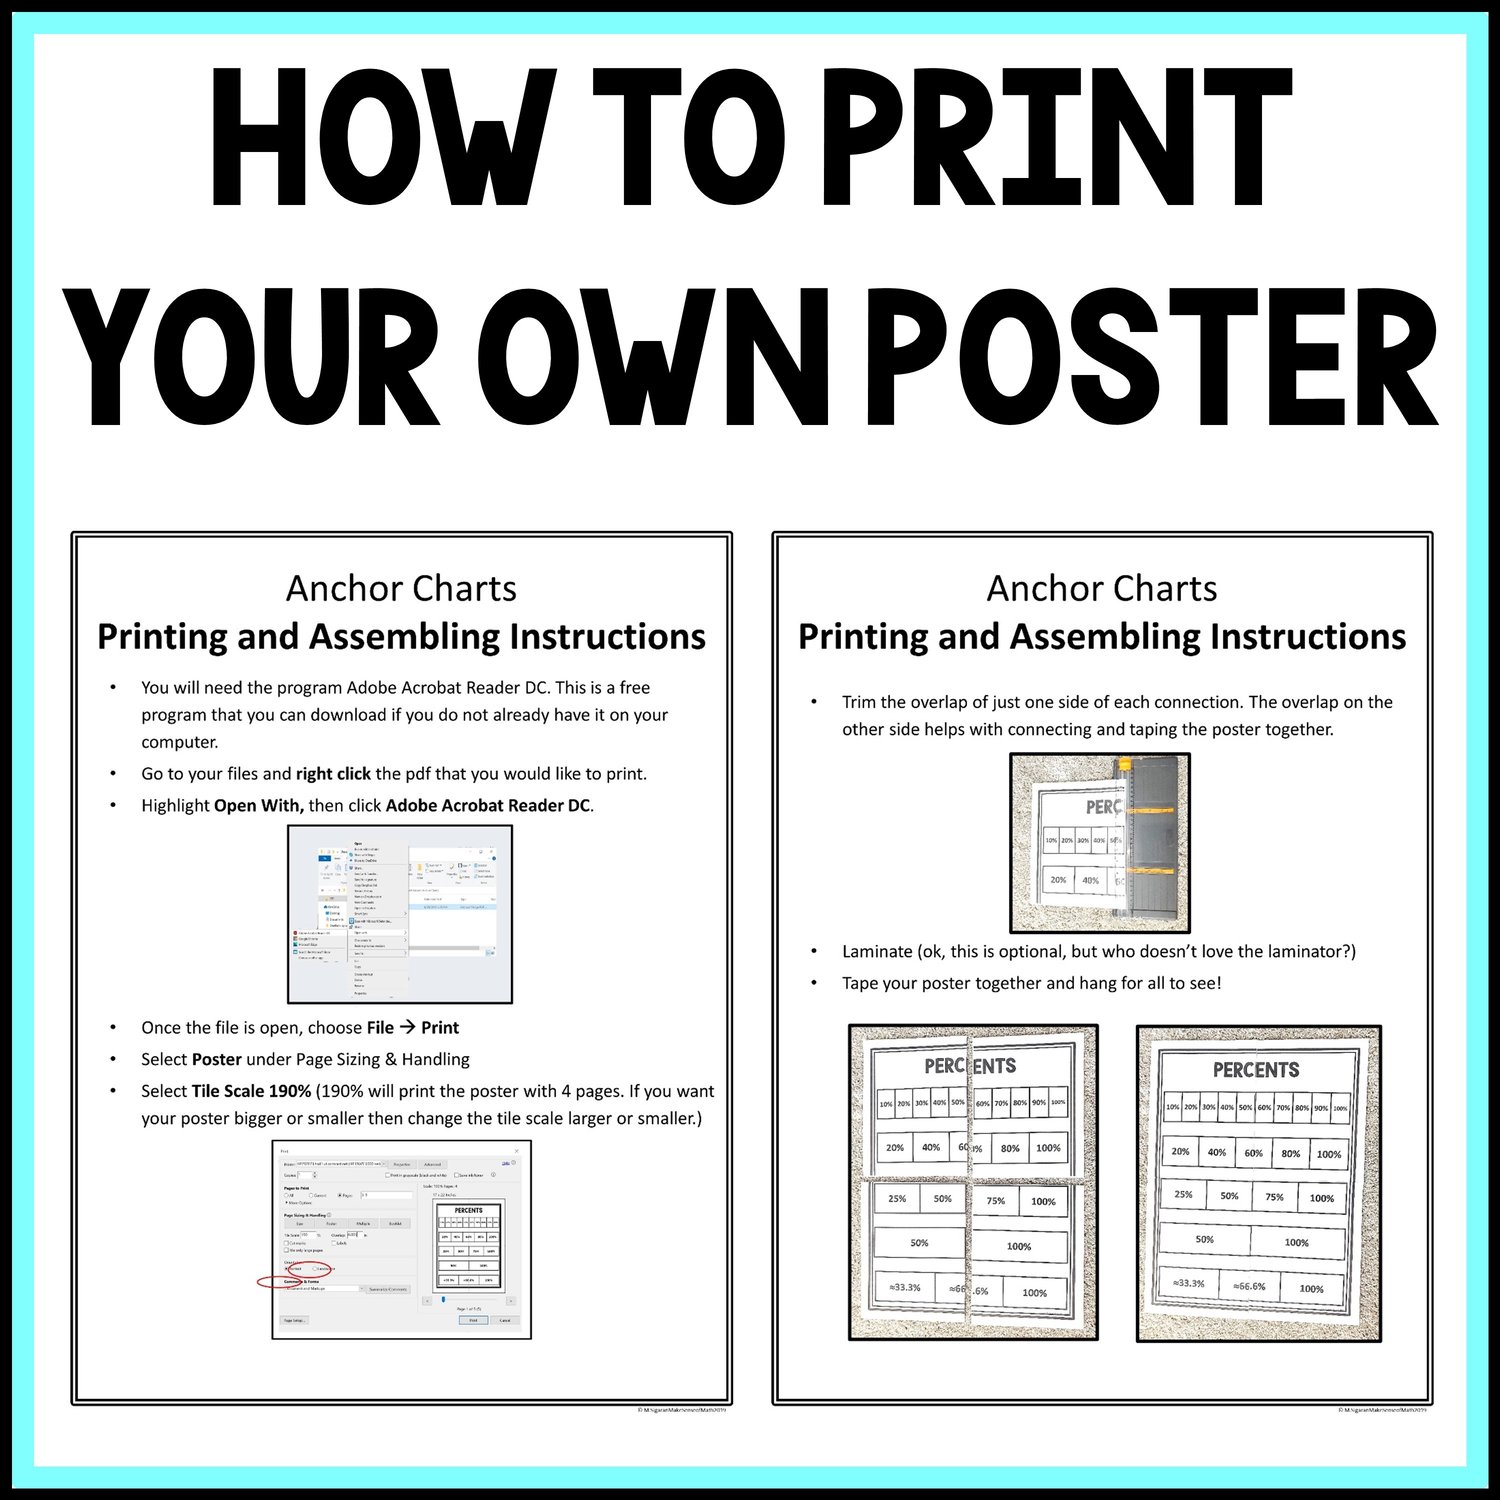
- How to create your own poster instructions
Please feel free to contact me with any questions!
Michelle,
Make Sense of Math
No refunds will be given. Please contact me for any questions. 😊
One purchase is for one teacher/family. You may only use this item with students in a single classroom/family.
Copyright © Michelle Sigaran Make Sense of Math, All Rights Reserved.
This item is also bound by copyright laws. Redistributing, editing, selling, or posting this item (or any part thereof) freely on the Internet are all strictly prohibited without first gaining permission from the author. Violations are subject to the penalties of the Digital Millennium Copyright Act.